Skip to main content Skip to main navigation Skip to footer
Logins
Explore Learning
Explore Learning
  • About Us
    • Overview
    • Our Story
    • Our Team
    • News
  • Our Products
    • Overview
    • Gizmos
    • Reflex
    • Frax
    • Science4Us
    • Math Solutions
    • Science Solutions
    • Site Status
    • Testimonials
  • Research
  • Resources
    • Overview
    • Educator Resource Hub
    • Product Support
    • Success Stories
    • Insights
    • Download Library
    • Professional Development
  • Careers
  • Get Access
    • Contact
    • Free Trial
    • Request a Pilot
  • Logins
  • Home
  • Resources
  • Insights
  • Research Article

Grade 2 Test Scores Improve with Reflex

  • Research
  • Reflex
Line graph showing Grade 2 Test Scores Improve...

Program Overview

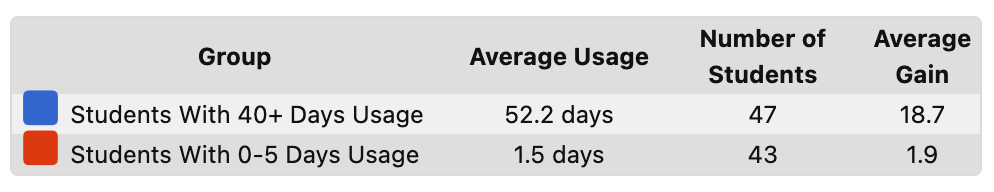
During the 2012-2013 school year, 322 grade 2 students from 6 Charlottesville City Schools (VA) had access to Reflex in their math program. The study compared fall and spring Measures of Academic Performance (MAP) test results of high-usage students — those with at least 40 days of Reflex usage between test administrations — to students with low or no usage (0-5 days) during the same time period.

The Northwest Evaluation Association (NWEA) MAP Mathematics test is a nationally-normed, computer-adaptive assessment used in many U.S. school districts. By administering the test multiple times during a school year, educators can gain a detailed picture of each student's current mathematical level and measure student growth over time. Because the test is nationally-normed, they can also compare their students' growth to that of students across the country.

Student Growth Comparison

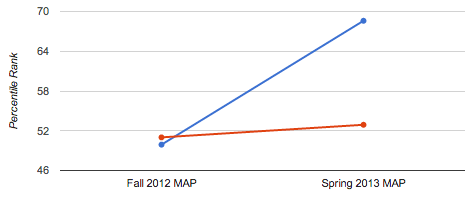
Fall 2012 MAP Math test results indicated starting average scores for both groups fell near the national median. The high-usage group ranked in the 49.9th percentile, while the low-usage group ranked in the 51st percentile.

By the 2013 spring administration, results for the two groups had clearly separated. The high-usage group had advanced to the 68.6th percentile, an increase of 18.7 percentile points, while the low-usage group remained near the national median, increasing 1.9 points to the 52.9th percentile.

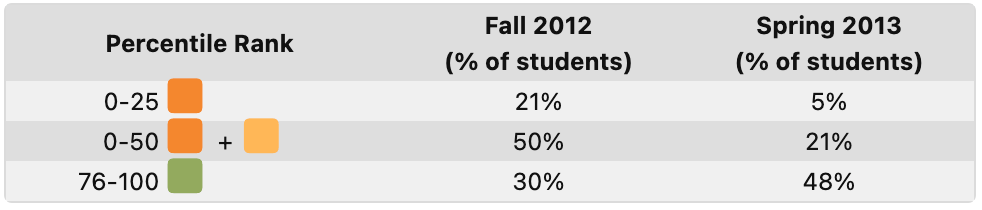
High Usage Group Percentile Growth

pie-graphs

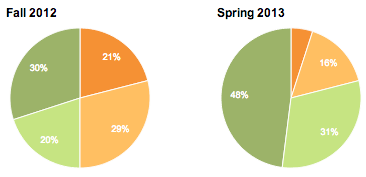
High-usage group students at both the low and high ends of national percentile ranks showed strong improvements.

The percentage of high-usage students in the lowest quartile declined from 21% to just 5%, and those in the lower half went from 50% to 21%. At the other end of the spectrum, the fraction of students in the top quartile increased from 30% to 48%.

You might also like these stories...

All Insights

Teaching Strategies

6 Effective Strategies for Student-Centered Learning

Teaching Strategies

Why Adaptive Instruction is Key for Differentiated STEM Learning

Educational Trends

The Power of Pairing: Accelerating Growth with ExploreLearning
STAY CONNECTED

Sign up to get the latest updates from ExploreLearning via occasional email.

Sign Up
Explore Learning logo

© 2025 ExploreLearning. All rights reserved.
Gizmo, Gizmos, Reflex, Frax, and Science4Us

Gizmos icon
Reflex icon
Frax icon
Science4Us icon
About Us
  • Overview
  • Our Story
  • Our Team
  • News
Our Products
  • Overview
  • Gizmos
  • Reflex
  • Frax
  • Science4Us
  • Math Solutions
  • Science Solutions
  • Site Status
  • Testimonials
Research Resources
  • Overview
  • Educator Resource Hub
  • Product Support
  • Success Stories
  • Insights
  • Download Library
  • Professional Development
Careers Contact Us

Get Connected

  • Toll-Free 866-882-4141
  • Local +1-434-293-7043
  • Newsletter Sign-Up
  • LinkedIn
  • Twitter
  • Facebook
  • YouTube
  • instagram
Gizmos icon
Reflex icon
Frax icon
Science4Us icon

© 2025 ExploreLearning. All rights reserved.
Gizmo, Gizmos, Reflex, Frax, and Science4Us

  • Privacy Policy
  • Terms of Use
  • Do Not Sell My Personal Information
  • Sitemap
A Cambium Learning Group Brand