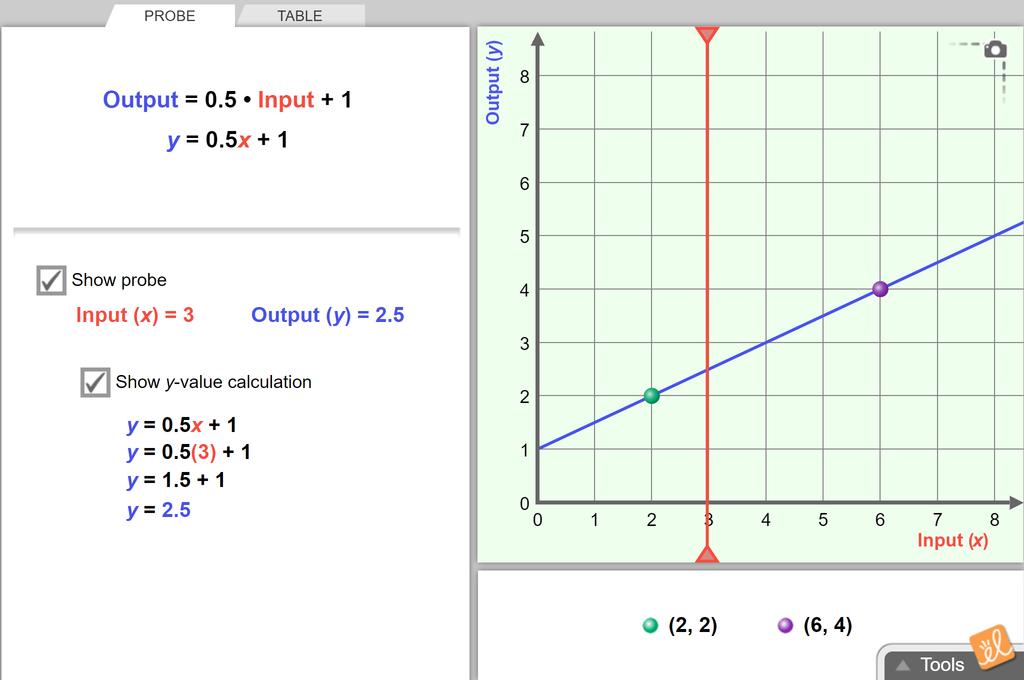
Points, Lines, and Equations
Compare the graph of a linear function to its rule and to a table of its values. Change the function by dragging two points on the line. Examine how the rule and table change.
Video Preview Launch GizmoPoints, Lines, and Equations
Compare the graph of a linear function to its rule and to a table of its values. Change the function by dragging two points on the line. Examine how the rule and table change.
5 Minute Preview
Use for 5 minutes a day.