Reaction Time 1 (Graphs and Statistics)
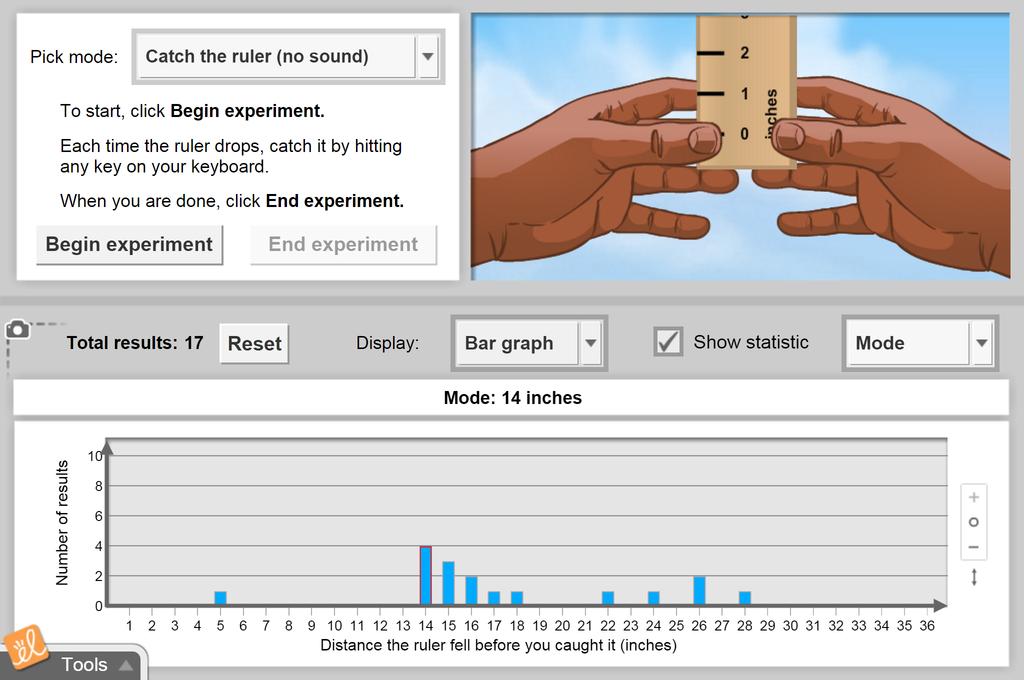
Test your reaction time by catching a falling ruler or clicking a target. Create a data set of experiment results, and calculate the range, mode, median, and mean of your data. Data can be displayed on a list, table, bar graph or dot plot. The Reaction Time 1 Student Exploration focuses on range, mode, and median.
Video Preview Launch GizmoReaction Time 1 (Graphs and Statistics)
Test your reaction time by catching a falling ruler or clicking a target. Create a data set of experiment results, and calculate the range, mode, median, and mean of your data. Data can be displayed on a list, table, bar graph or dot plot. The Reaction Time 1 Student Exploration focuses on range, mode, and median.
5 Minute Preview
Use for 5 minutes a day.
LEARNING OBJECTIVES:
- Read and interpret data on a list, table, bar graph, and dot plot.
- Determine basic statistics including range, mode, and median of a data set.
- Compare data sets from related experiments.
- Draw conclusions based on data.
VOCABULARY:
- bar graph, data, dot plot, median, mode, range