Linear Programming
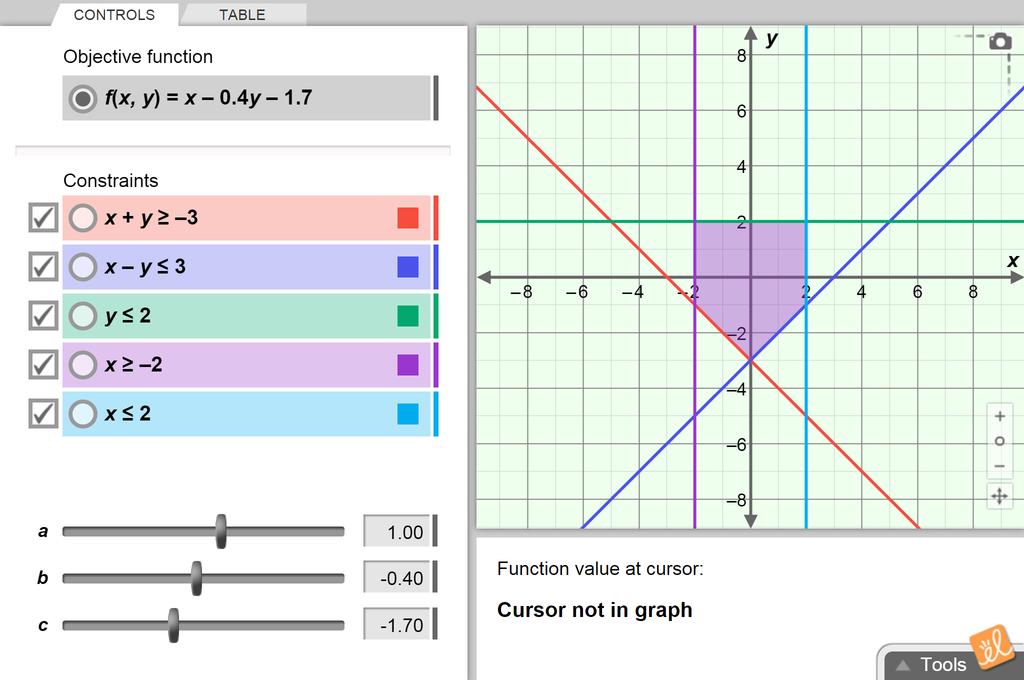
Use the graph of the feasible region to find the maximum or minimum value of the objective function. Vary the coefficients of the objective function and vary the constraints. Explore how the graph of the feasible region changes in response.
Launch GizmoLinear Programming
Use the graph of the feasible region to find the maximum or minimum value of the objective function. Vary the coefficients of the objective function and vary the constraints. Explore how the graph of the feasible region changes in response.
Free Gizmo
Full access with a free account.
Questions Recommend
