Mascot Election (Pictographs and Bar Graphs)
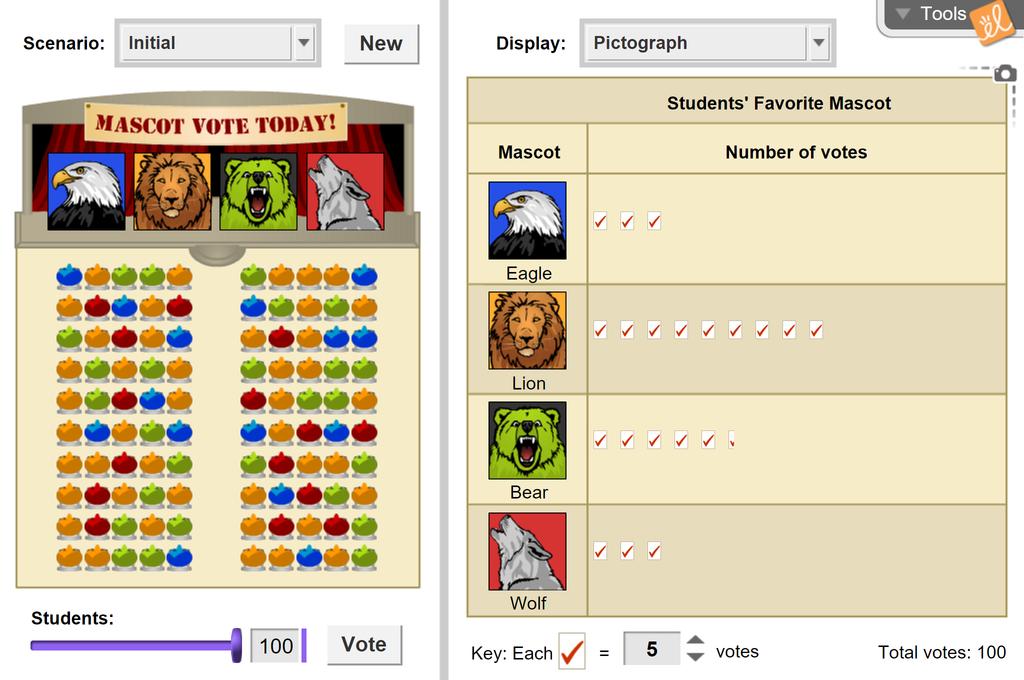
A brand new school is opening and it is time to elect the school mascot! Students can choose the Eagle, Lion, Bear, or Wolf. Voting results can be displayed in a table, tally chart, pictograph, bar graph, circle graph, or dot plot. You can change student votes by selecting a group of students and clicking a mascot.
Video Preview Launch GizmoMascot Election (Pictographs and Bar Graphs)
A brand new school is opening and it is time to elect the school mascot! Students can choose the Eagle, Lion, Bear, or Wolf. Voting results can be displayed in a table, tally chart, pictograph, bar graph, circle graph, or dot plot. You can change student votes by selecting a group of students and clicking a mascot.
5 Minute Preview
Use for 5 minutes a day.
LEARNING OBJECTIVES:
- Read and interpret data in frequency tables, tally charts, pictographs, and bar graphs.
- State the relationship between pictographs and bar graphs.
- Choose an appropriate scale to display data on a pictograph and bar graph.
VOCABULARY:
- bar graph, frequency, frequency table, horizontal axis, pictograph, scale, tally chart