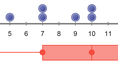
Box-and-Whisker Plots


Construct a box‑and‑whisker plot to match a line plots, and construct a line plot to match a box‑and‑whisker plots. Manipulate the line plot and examine how the box‑and‑whisker plot changes. Then manipulate the box‑and‑whisker plot and examine how the line plot changes.

Time remaining to use this Gizmo: 5:00     Extend your five minute free pass.

Assessment Questions (5):

  1. Find the value of Q1 for these values:

    2, 4, 6, 8, 10, 12, 14.
  2. Find the quartiles for these data values:

    5, 7, 7, 8, 10, 11, 12, 15, 17.
  3. Compare the quantity in column A with the quantity in column B. Choose the best answer.

    73, 56, 88, 94, 100, 87, 92, 100, 78

    column a contains q2 of the above data and column b contains the median of the above data
  4. The interquartile range (IQR) is defined as the difference between the first and third quartiles (Q3Q1). What feature of the box-and-whisker plot does the IQR describe?
  5. Suppose you received these grades on your last five quizzes: 16, 17, 18, 19, and 20. If you get 20's on the next three quizzes, which of the following would change?

    I. Q1       II. Q2        III. Q3       IV. minimum       V. maximum

Session Timeout Notice

Your ExploreLearning user session will timeout in 5:00.

Would you like to stay logged in and continue your current session?
logout ignore